elasticflow 是个流量分析工具,通过对各种flow流量的抓取,分析数据,可以清晰的看到局域网中的流量。
网管的必备啊。首先要把sflow流量给发过来。(这里172.18.31.23是服务器端)
sflow collector 2 ip 172.18.31.23 description flow-server
拉取源代码:
git clone https://github.com/robcowart/elastiflow
启动集群
docker-compose up -d
这样整个数据会被清空,需要重新生成一遍,先把kibana的数据文件拉回来
wget https://raw.githubusercontent.com/robcowart/elastiflow/master/kibana/elastiflow.kibana.7.8.x.ndjson
先到配置,导入
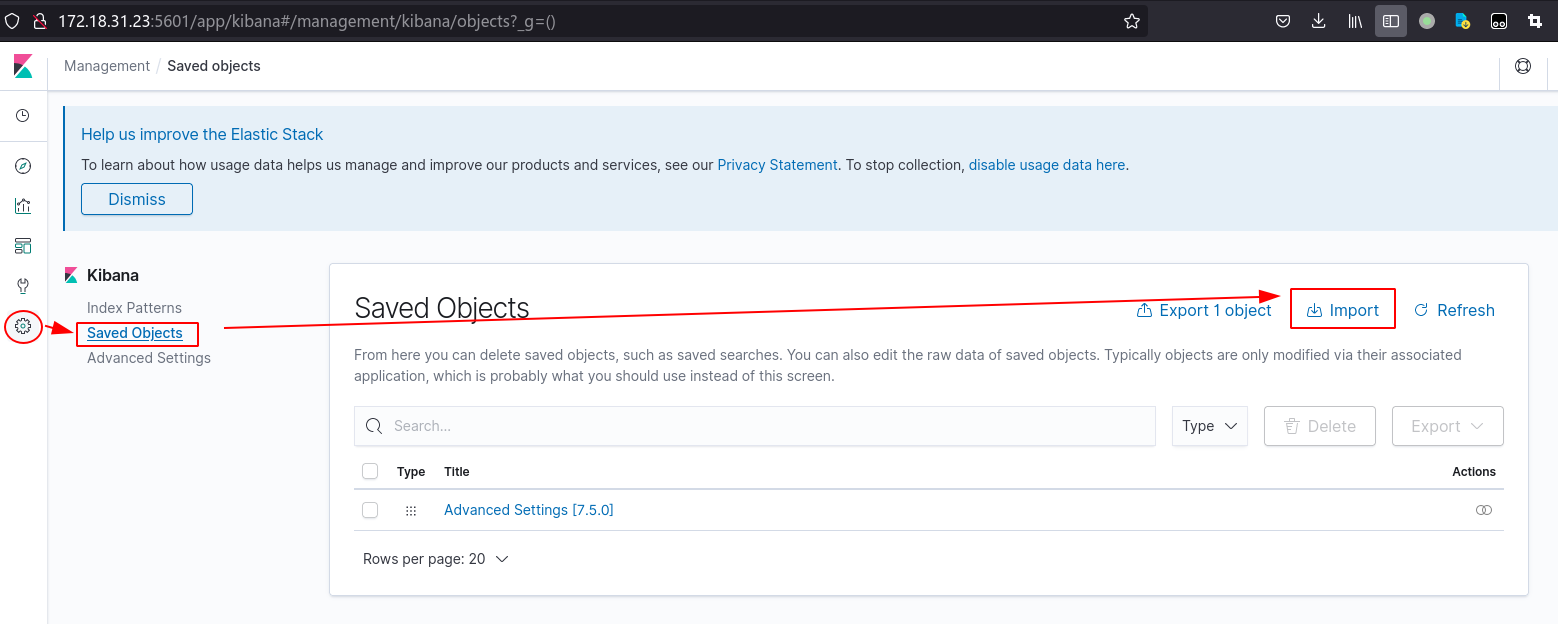
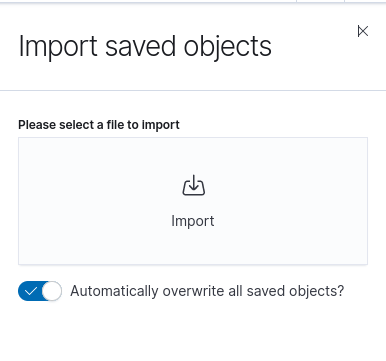
导入对象,选择elastiflow.kibana.7.8.x.ndjson文件上传
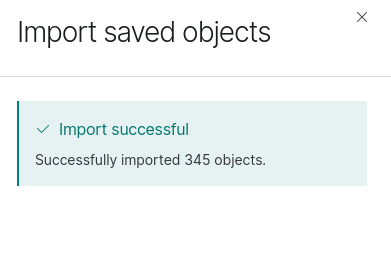
导入成功,导入了300多个对象
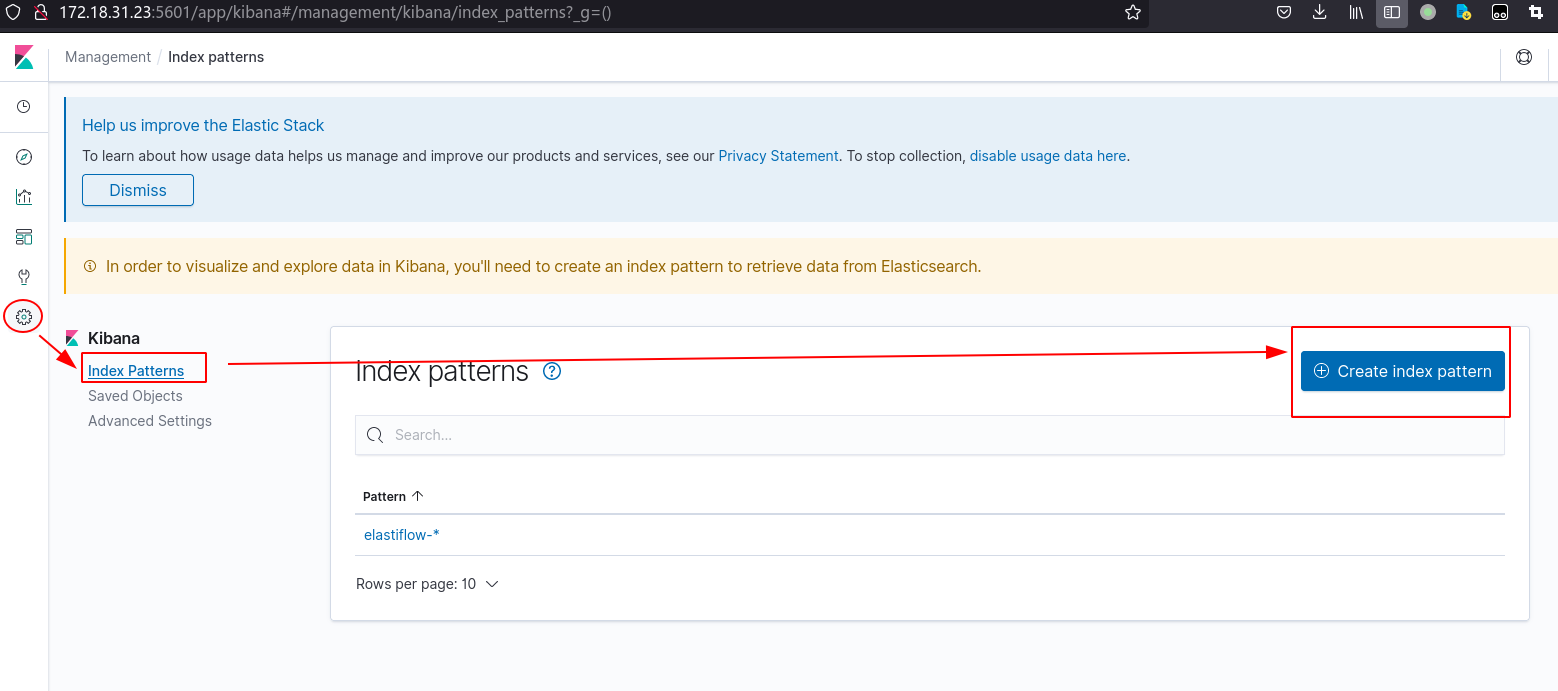
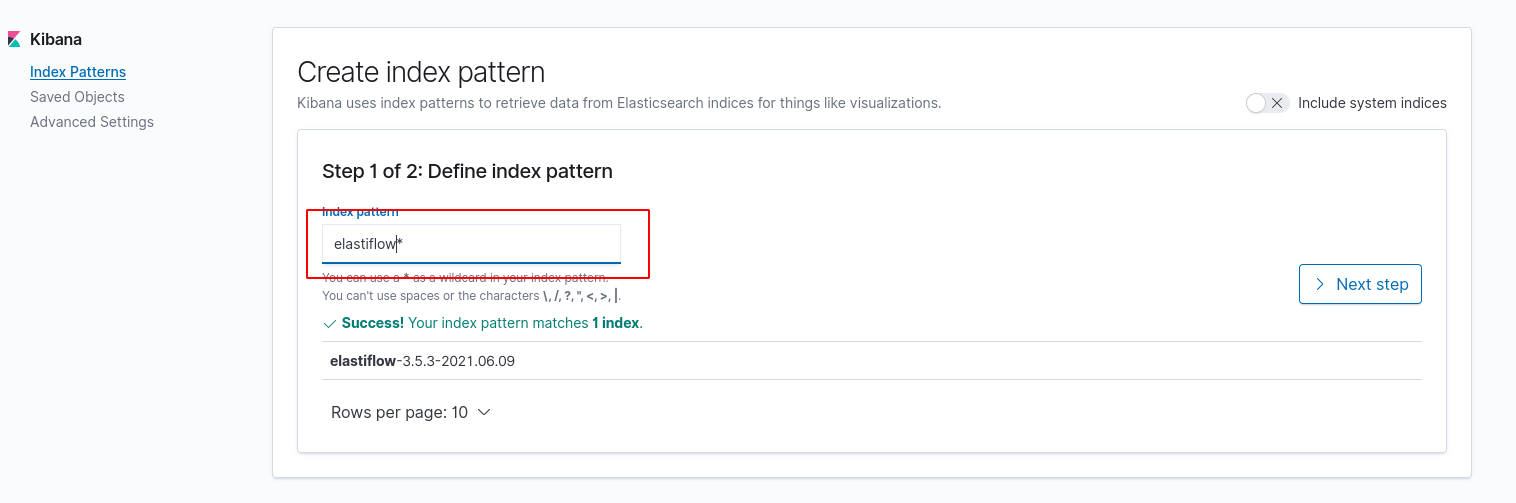
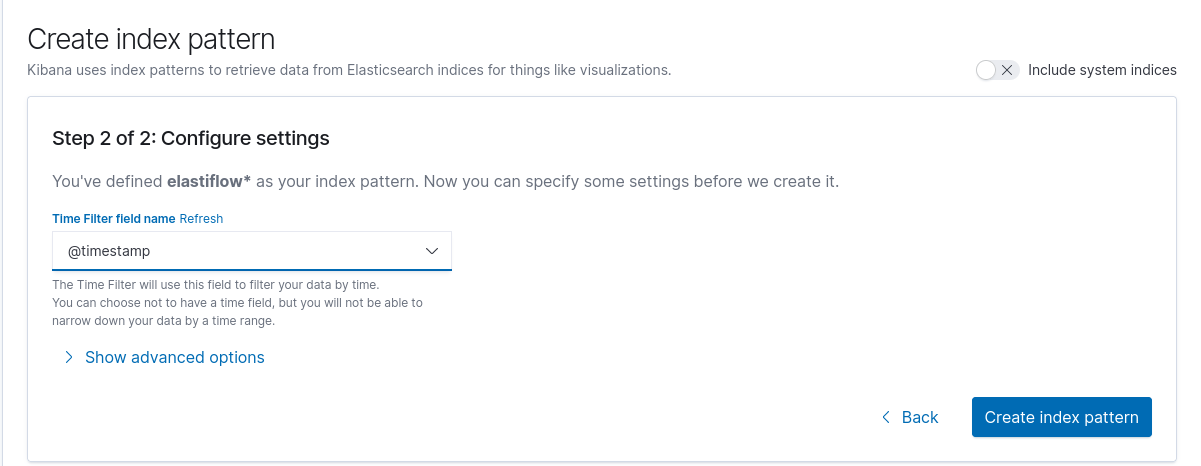
然后配置索引,应该不用配,直接选一个做default
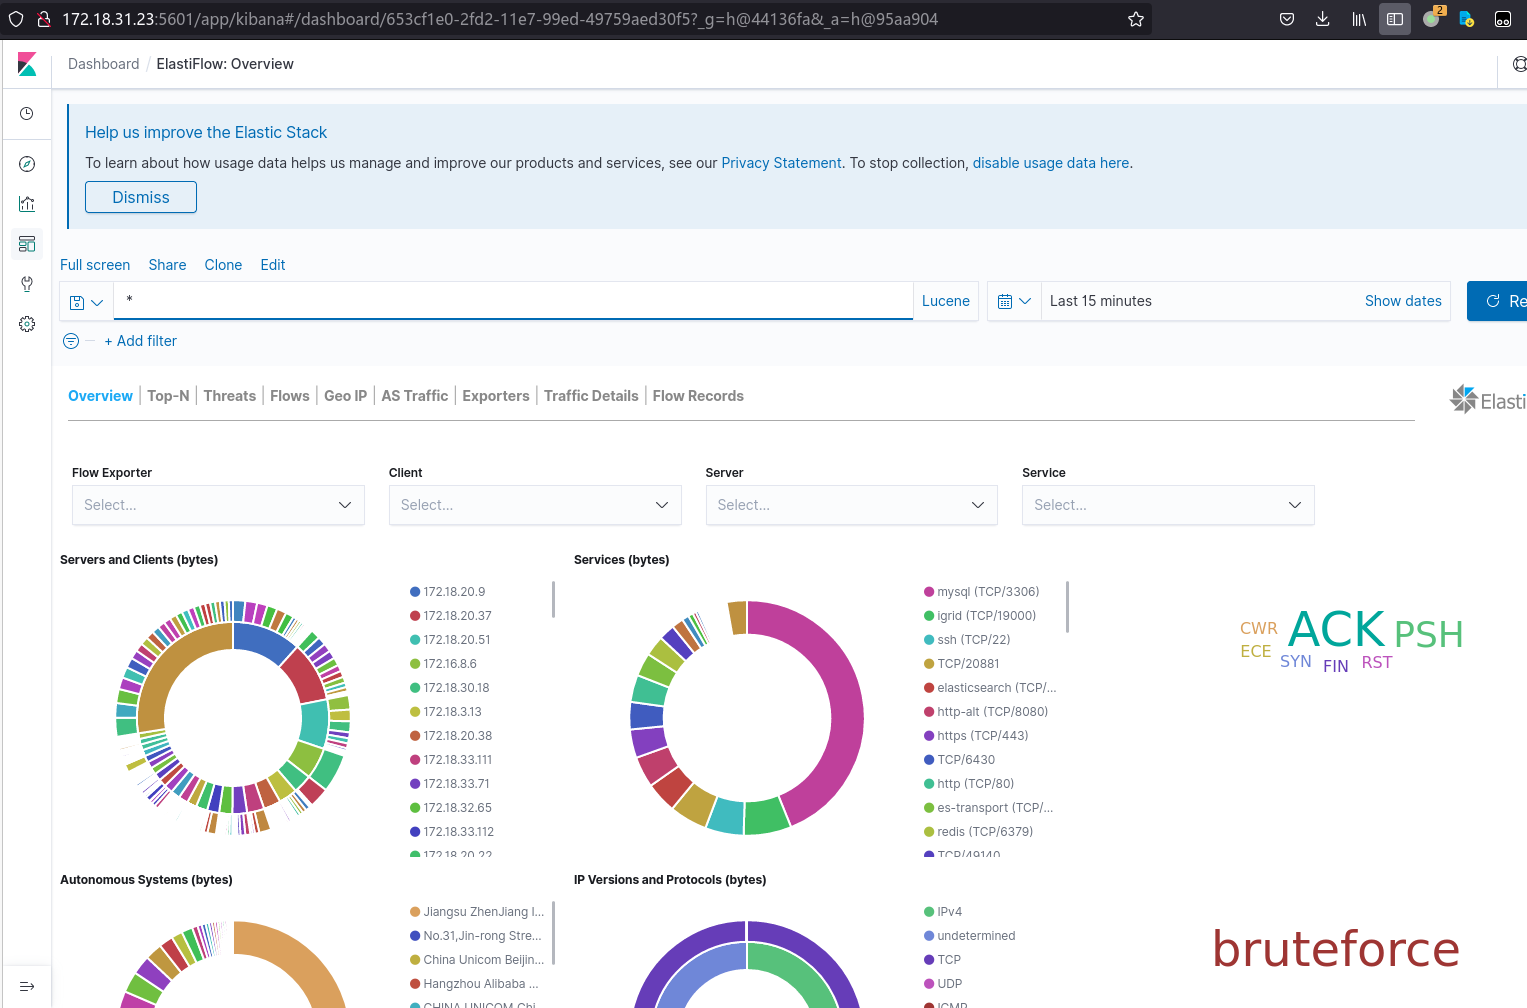
这样就ok了,去dashboard的overview就能看到东西了
然后去修改一下shard策略,省得索引报黄色
PUT /_template/elastiflow-3.5.3
{
  "index_patterns": "*",
  "settings": {
    "number_of_shards": 1
  }
}
PUT /_template/index_defaults
{
  "index_patterns": "*",
  "settings": {
  "number_of_shards": 1
  }
}
PUT /_template/elastiflow-3.5.3
{
  "index_patterns": "elastiflow-3.5.3-*",
  "settings": {
    "number_of_shards": 1
  }
}
查看一下:
curl -s -X GET 'http://localhost:9200/_cat/indices?v'
curl -s -X GET 'http://localhost:9200/_template'| jq