suricata 是跟snort差不多的一个入侵检测工具,加上elk的图形界面,非常的好看。
原理是suricata的log发到elk里,这样就能通过kibana进行分析了
环境:
1、物理机需要开16G内存,16CPU,都不太够 2、物理机172.18.30.2的br3是交换机的Mirror口,进入的全部流量都被镜像了一份 3、suricata-18-31-31是虚机,需要将30.2的br3挂进来
virsh attach-interface  --domain suricata-18-31-31 --type bridge --source br3 --model e1000 --config --live
同时在31.31里,ifconfig up eth1把网卡起起来
tcpdump -i eth1有数据即可
4、首先安装java
rpm -ivh jdk-8u201-linux-x64.rpm
安装: 一、编译安装suricata
yum -y install epel-release

yum -y install jq cargo openssl-devel PyYAML lz4-devel gcc libpcap-devel pcre-devel libyaml-devel file-devel zlib-devel jansson-devel nss-devel libcap-ng-devel libnet-devel tar make libnetfilter_queue-devel lua-devel GeoIP-devel

wget https://www.openinfosecfoundation.org/download/suricata-4.1.8.tar.gz
tar zxvf suricata-4.1.8.tar.gz
cd suricata
./configure --libdir=/usr/lib64 --prefix=/usr --sysconfdir=/etc --localstatedir=/var --enable-nfqueue --enable-lua --enable-geoip --enable-profiling
make
make install-full

验证一下
suricata -V
This is Suricata version 4.1.8 RELEASE

查看build参数
suricata --build-info
suricata就装好了,还需要配一下suricata-update,规则才是最主要的,装好后最好每天更新一下规则
suricata-update update-sources
suricata-update list-sources

suricata-update enable-source ptresearch/attackdetection
suricata-update enable-source oisf/trafficid
suricata-update enable-source sslbl/ssl-fp-blacklist

suricata-update
suricata-update的用法
suricata-update list-enabled-sources
suricata-update disable-source et/pro
suricata-update remove-source et/pro
测试规则:
suricata -T
/etc/suricata/suricata.yaml的修改部分
HOME_NET: "[43.231.149.0/25]"
outputs被改过
outputs:
app-layer被改过
app-layer:
具体看附件中的suricata.yaml
启动:
/usr/bin/suricata -c /etc/suricata/suricata.yaml -i eth1 -D
二、编译安装ELK
rpm --import https://artifacts.elastic.co/GPG-KEY-elasticsearch

cat <<EOF | sudo tee /etc/yum.repos.d/elasticsearch.repo
[elasticsearch-7.x]
name=Elasticsearch repository for 7.x packages
baseurl=https://artifacts.elastic.co/packages/7.x/yum
gpgcheck=1
gpgkey=https://artifacts.elastic.co/GPG-KEY-elasticsearch
enabled=1
autorefresh=1
type=rpm-md
EOF

yum clean all
yum makecache

yum install -y elasticsearch logstash kibana filebeat
安装的时候最好设一下翻墙,否则下这几个包非常慢!!!
然后一个一个来设置
1、设置elasticsearch
vi /etc/elasticsearch/jvm.options
-Xms4g
-Xmx4g
vi /etc/elasticsearch/elasticsearch.yml
indices.query.bool.max_clause_count: 8192
search.max_buckets: 250000

systemctl enable --now elasticsearch

2、设置logstash
将附件中logstash目录下的synlite_suricata/目录完整挪到/etc/logstash下
/etc/logstash/synlite_suricata/

将附件中logstash目录下的pipelines.yml拷贝到/etc/logstash下
/etc/logstash/pipelines.yml

将附件中logstash目录下的logstash.service拷贝覆盖掉/etc/systemd/system/logstast.service
/etc/systemd/system/logstash.service

vi /etc/logstash/jvm.options
-Xms4g
-Xmx4g

systemctl daemon-reload
systemctl enable --now logstash

3、设置filebeat
vi /etc/filebeat/filebeat.yml
filebeat.inputs:
- type: log
  enabled: true
  paths:
    - /var/log/suricata/eve.json
  fields:
    event.type: suricata

output.logstash:
  hosts: ["127.0.0.1:5044"]
  #ssl.certificate_authorities: ["/etc/pki/root/ca.pem"]
  #ssl.certificate: "/etc/pki/client/cert.pem"
  #ssl.key: "/etc/pki/client/cert.key"

systemctl enable --now logstash

4、设置kibana
vi /etc/kibana/kibana.yml
server.host: "172.18.31.31"

systemctl enable --new kibana
跑起来以后打开 http://172.18.31.31:5601 就可以看到了
如果不出意外,应该有数据了。需要建立一个suricata*的索引。
去kibana的home –> Stack Management
导入的synlite_suricata.kibana.7.1.x.json

然后在dashboard里就可以看到了
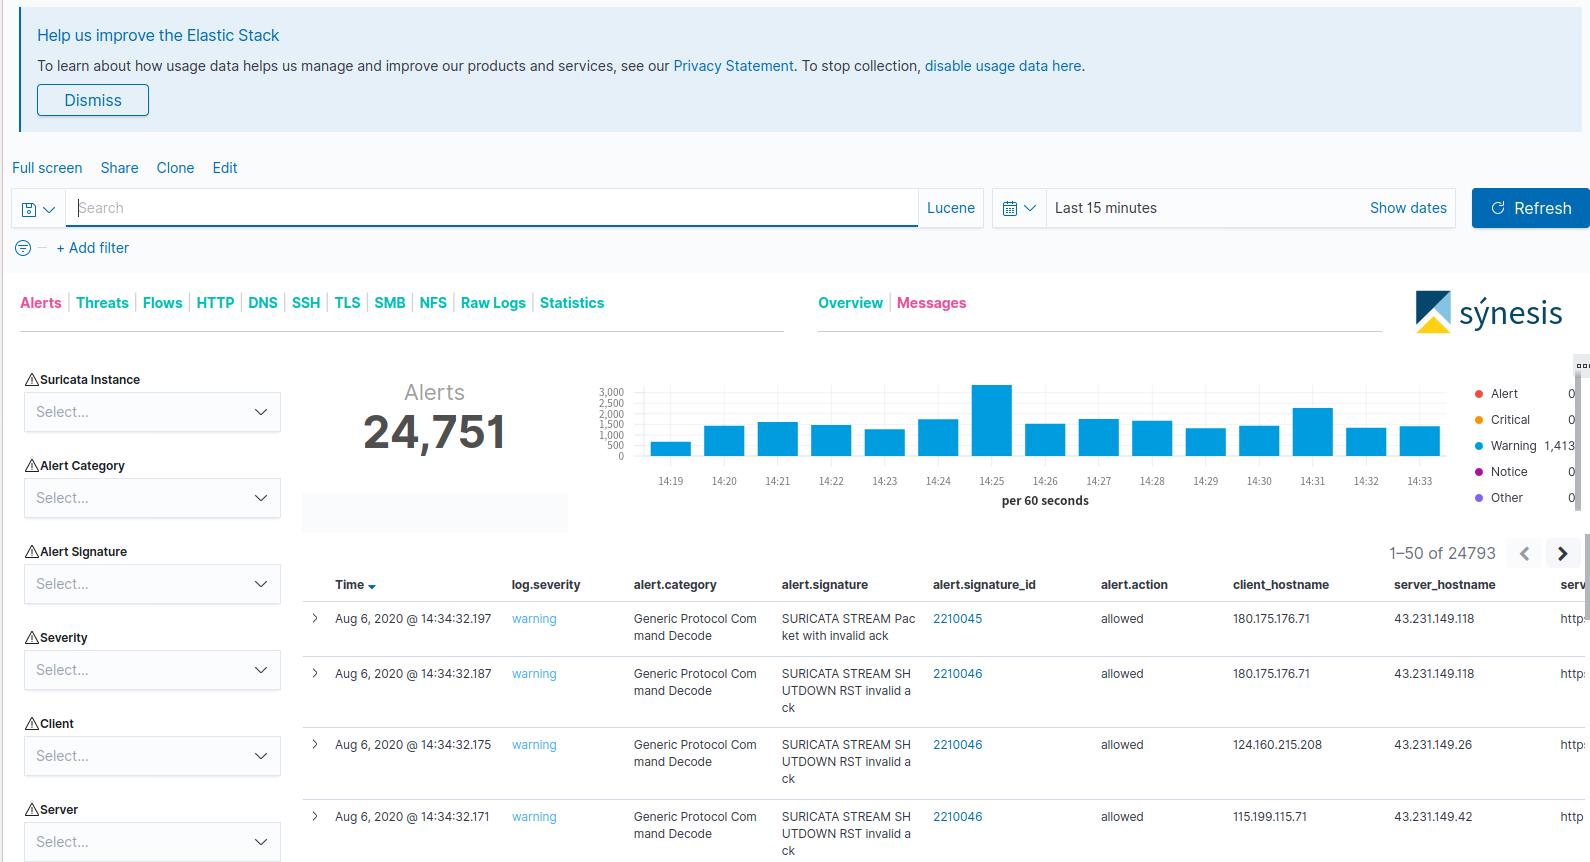
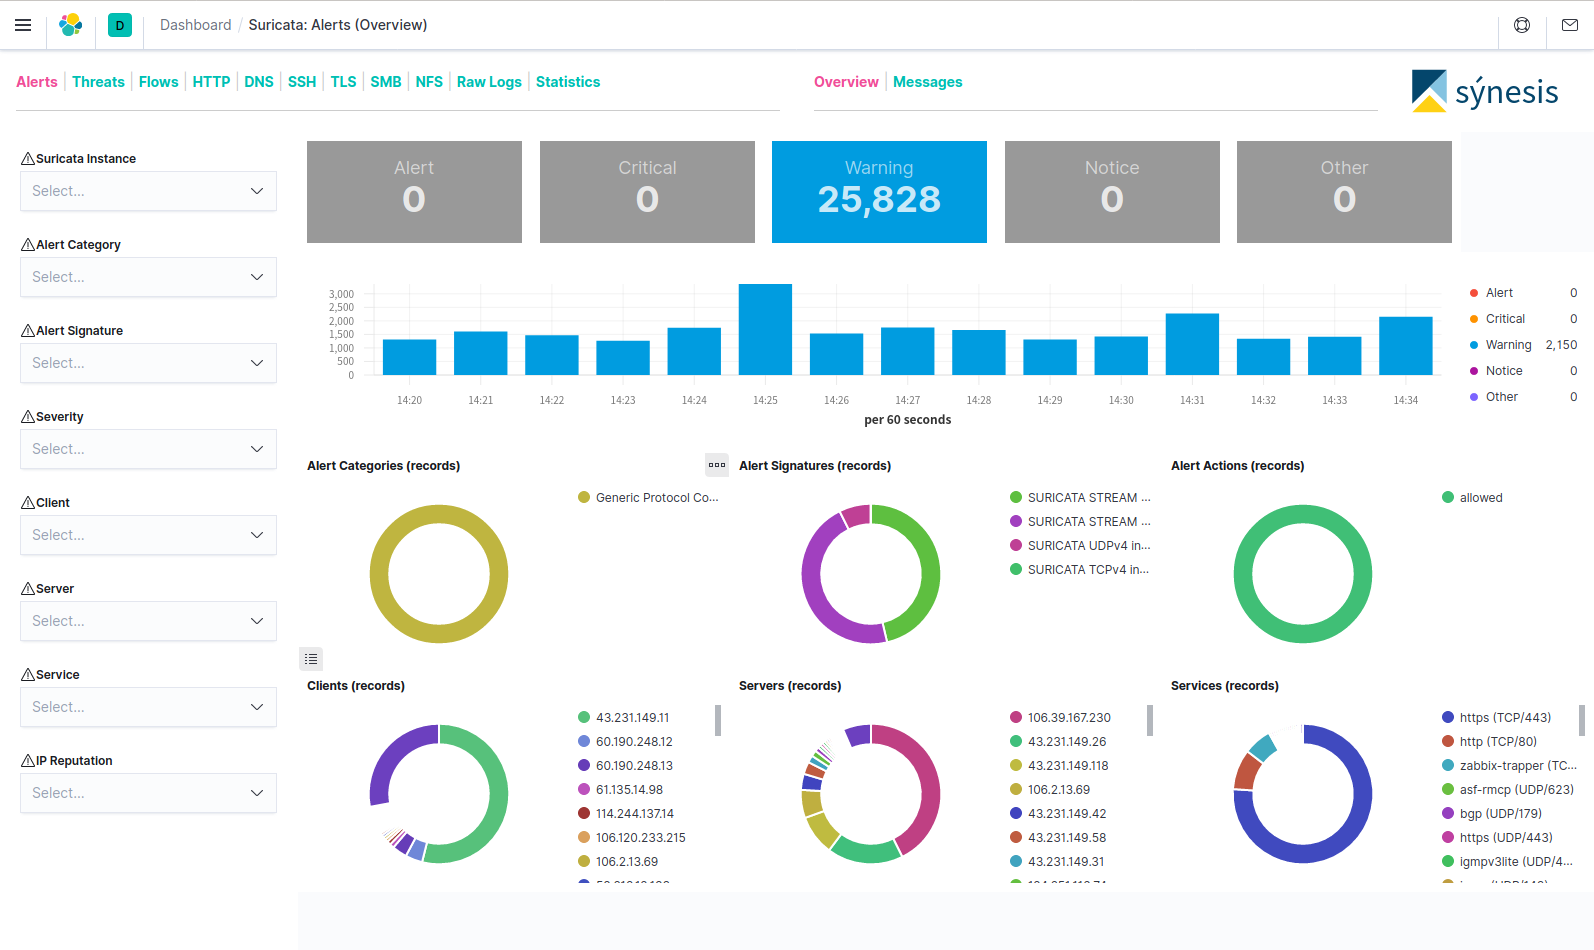
可以清楚的看到各种ipflow,流量分布。